Monitoring DigitalOcean volume disk usage using Awk and Grafana
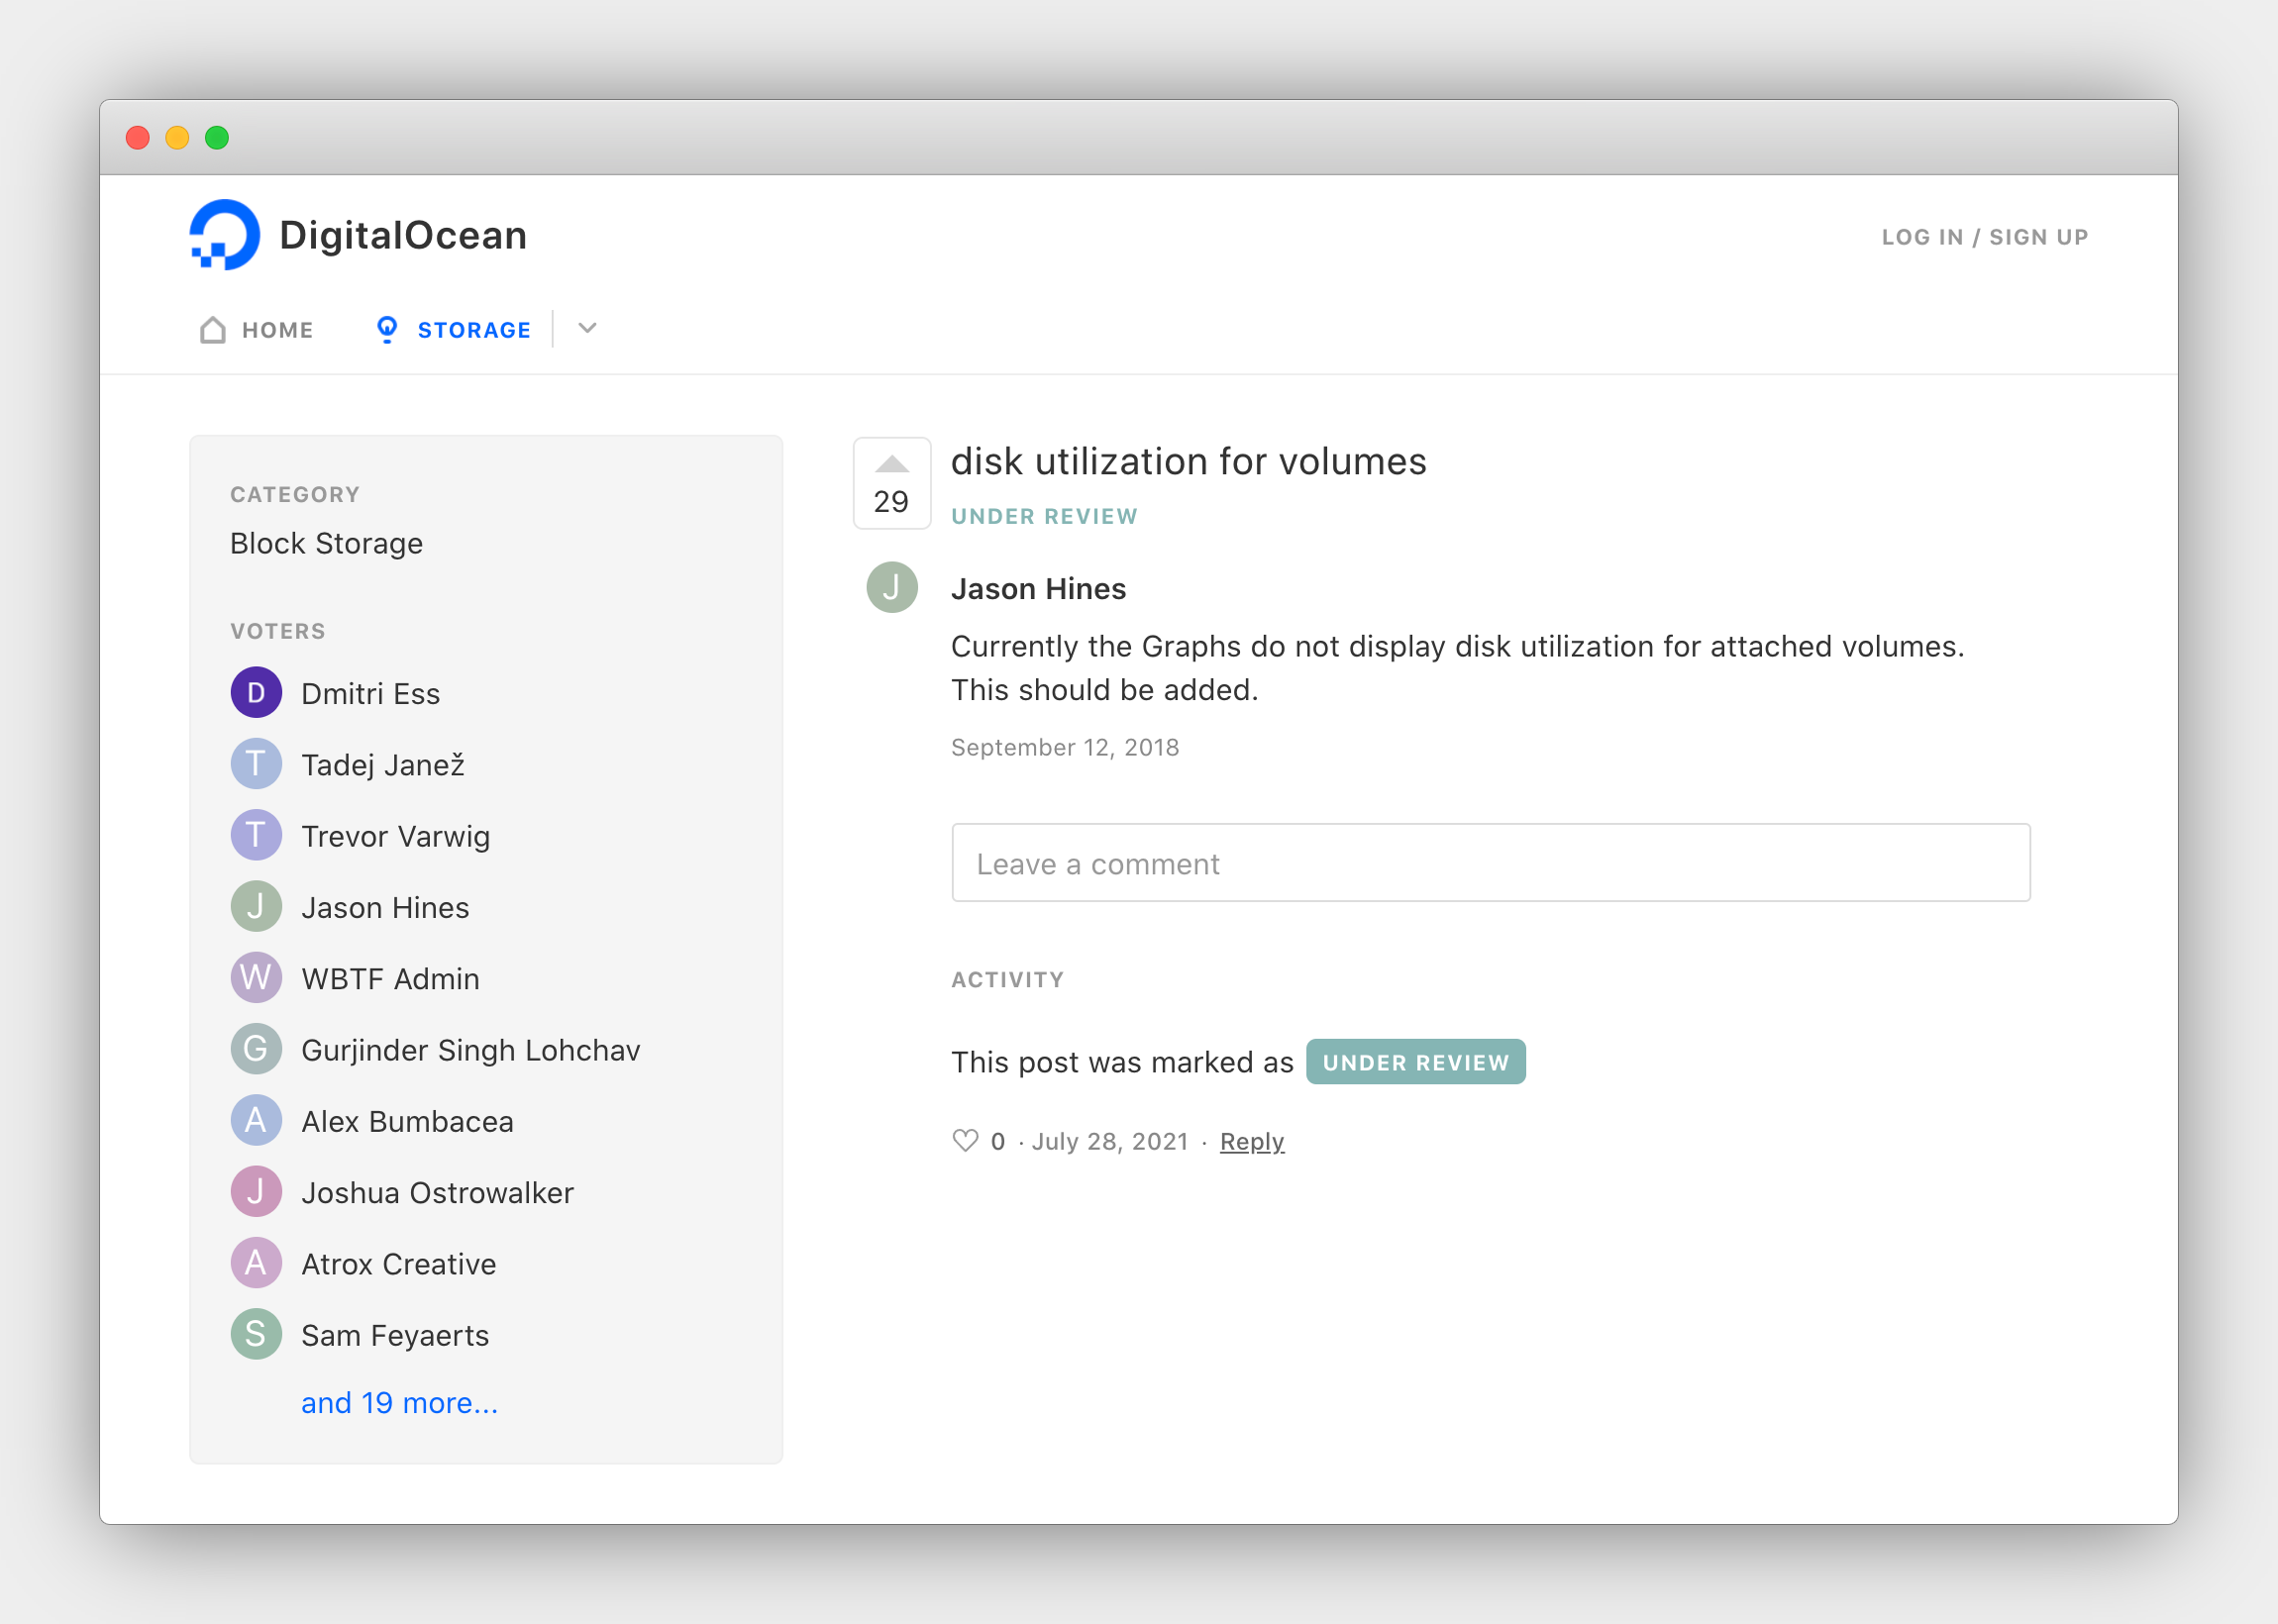
DigitalOcean has long supported monitoring and alerting for Droplet disk usage. Unfortunately there is currently no way to monitor the disk usage of attached volumes. For one of my MongoDB instances I use an attached storage volume in order to easily expand disk usage as needed. However, I needed some way of keeping track of when the volume starts to fill up…

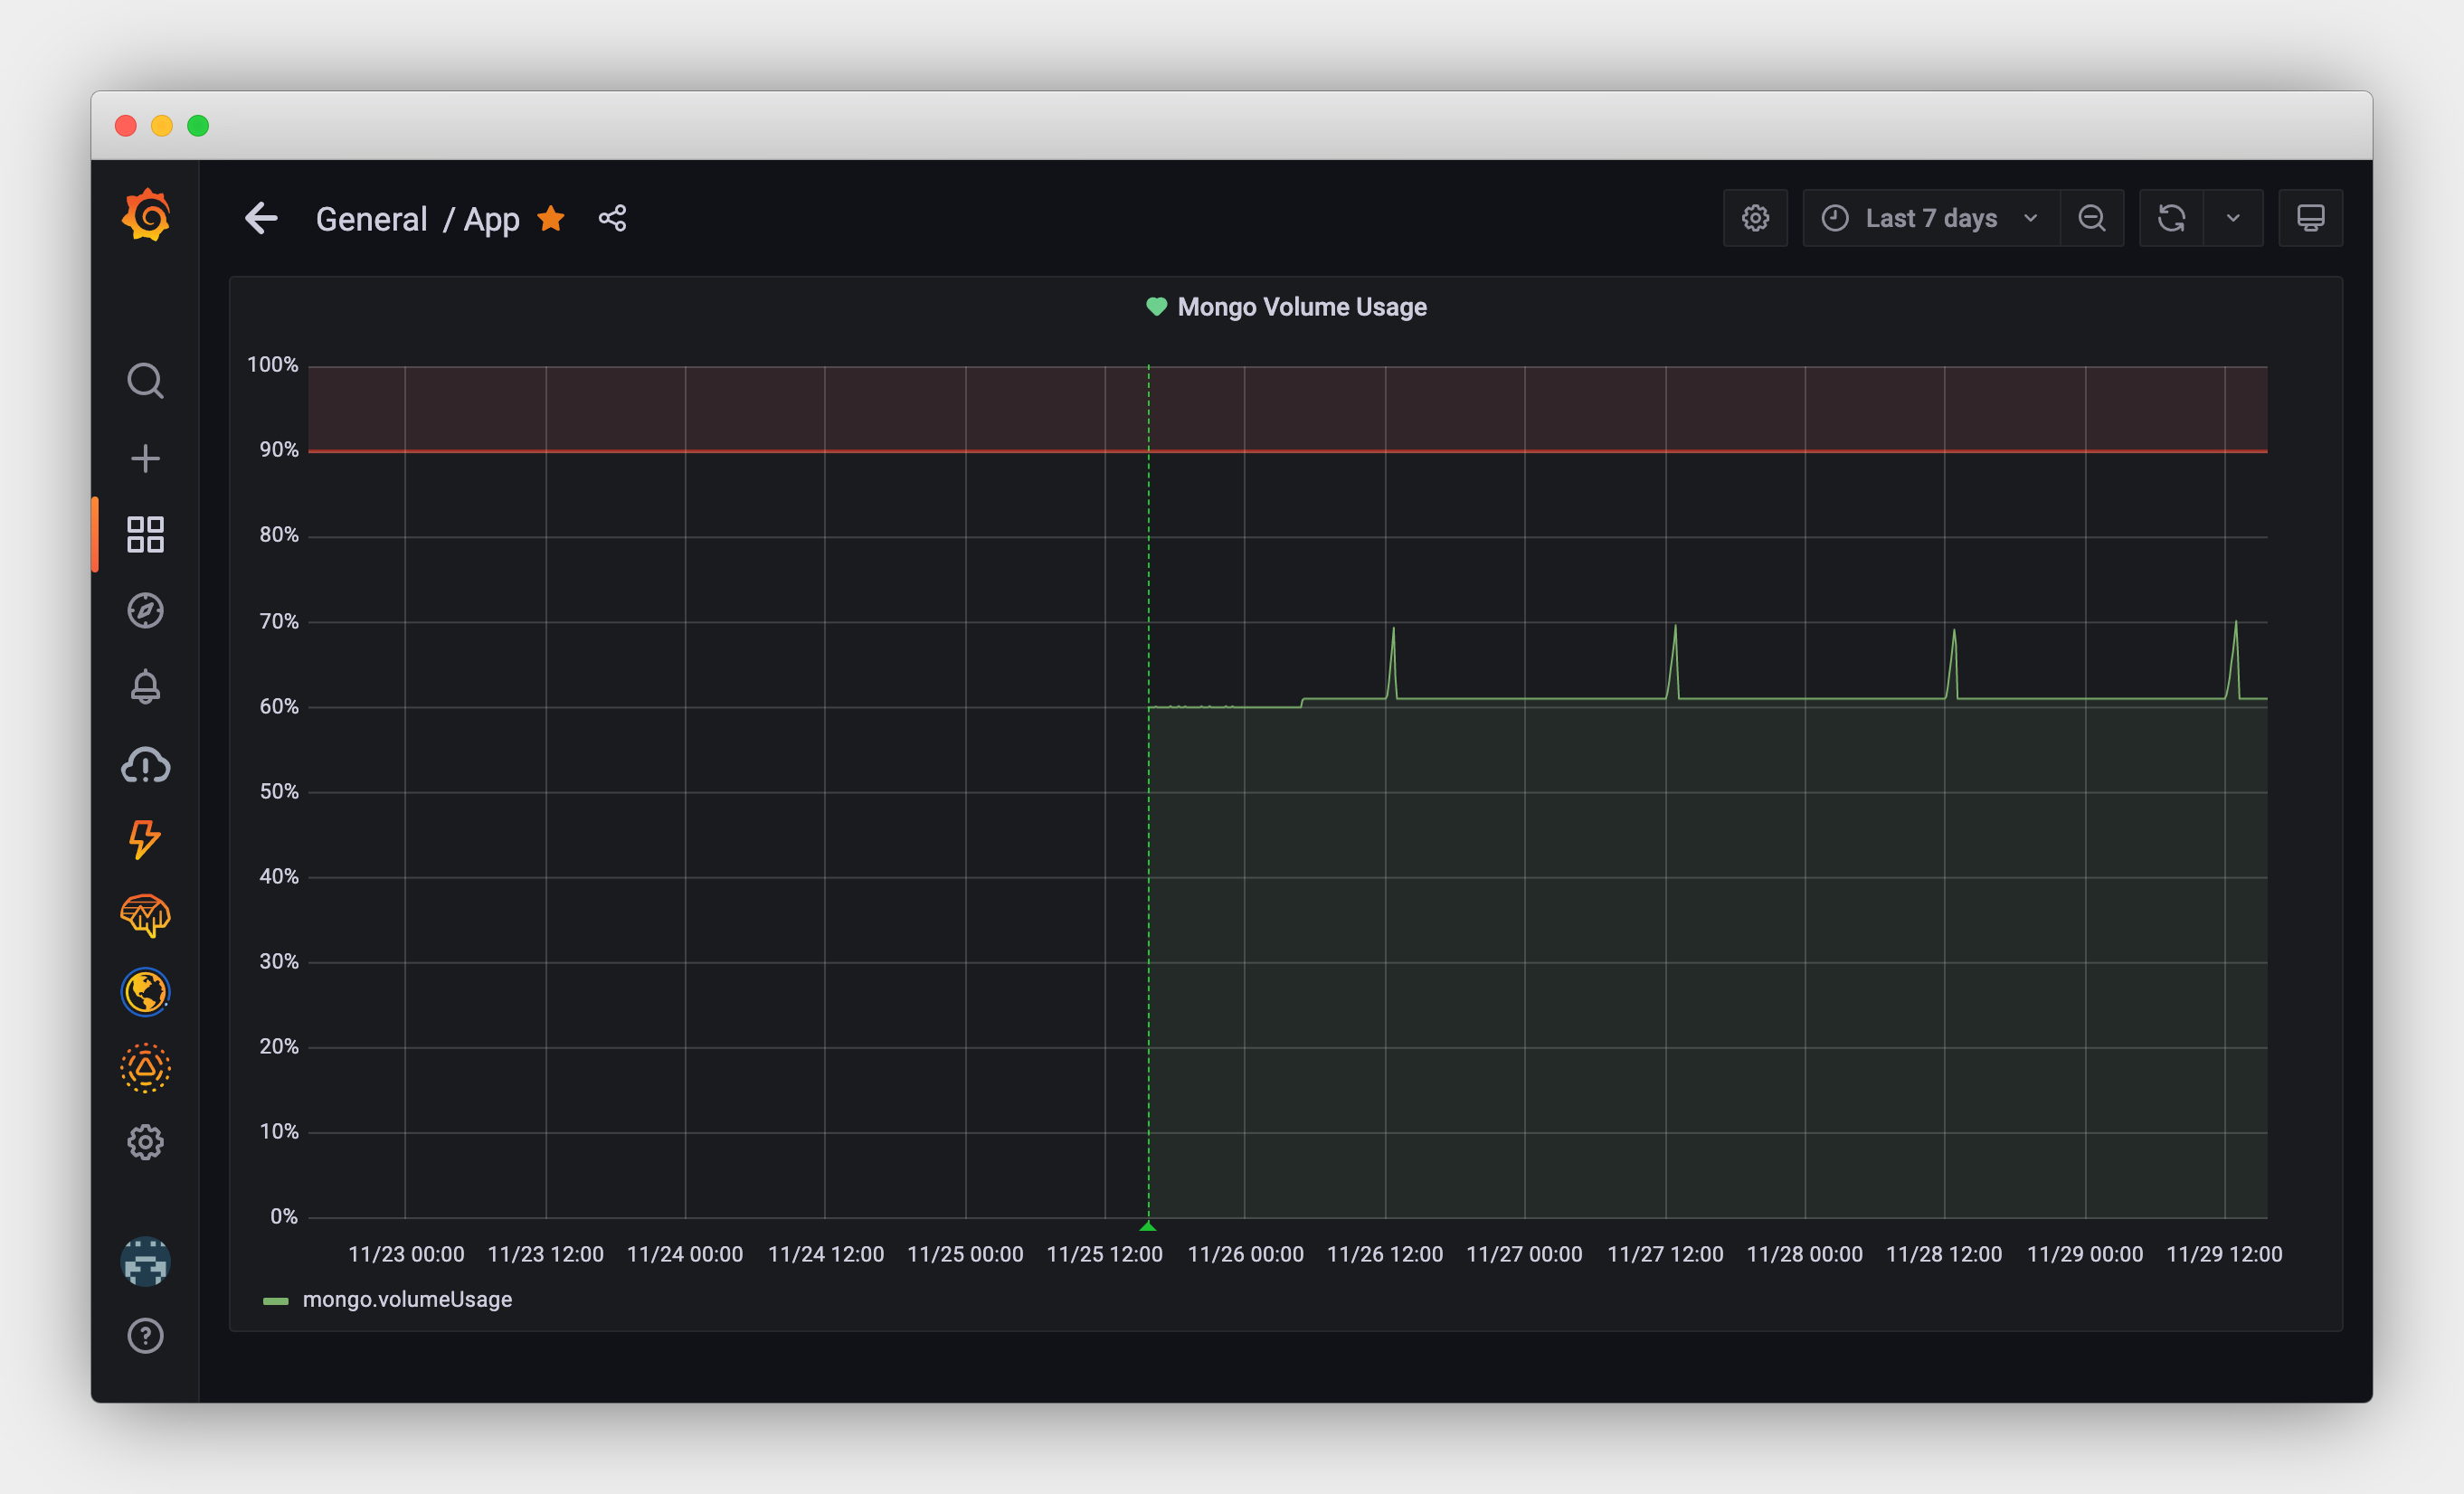
Since we already use Grafana Cloud for monitoring various app metrics I figured I could easily add something to monitor the volume disk usage as well. Rather than using something like Telegraf I figured a simple cron job bash script could probably do the job.
I’m sure there are many possible ways of doing this, but this is what I came up with, and it turned into en excuse for finally digging into how awk actually works.
Parsing volume disk usage
Starting with the basics, we can find the disk usage of our attached volume (/mnt/volume_fra1_mongo) using the df command:
$ df -h

Filesystem      Size  Used Avail Use% Mounted on
udev            2.0G     0  2.0G   0% /dev
tmpfs           395M  1.1M  394M   1% /run
/dev/vda1        78G   15G   64G  19% /
tmpfs           2.0G   16K  2.0G   1% /dev/shm
tmpfs           5.0M     0  5.0M   0% /run/lock
tmpfs           2.0G     0  2.0G   0% /sys/fs/cgroup
/dev/vda15      105M  8.9M   96M   9% /boot/efi
/dev/sda         50G   29G   19G  61% /mnt/volume_fra1_mongo
Since we only care about the usage of the mongo volume, we can narrow down the results by specifying the mount path to filter the output:
$ df -h /mnt/volume_fra1_mongo

Filesystem      Size  Used Avail Use% Mounted on
/dev/sda         50G   29G   19G  61% /mnt/volume_fra1_mongo
Next we need to figure out a way to extract only the disk usage percent value (61%). By default, df doesn’t provide any easy way to extract a single value without headers. So, we’ll have to use another tool to achieve this.
Awk is a great tool for extracting data from tabular output. You can think of awk as a way of parsing the above output into a series of rows and columns (called records and fields). In Awk every line is a record and the NR variable contains the current record number. So, to remove the headers, we can select the second line only by comparing the value of NR with the line number we want:
$ df -h /mnt/volume_fra1_mongo | awk 'NR==2'

 /dev/sda         50G   29G   19G  61% /mnt/volume_fra1_mongo
Next, to extract the disk usage percent column we can tell awk to only print the 5th column only. We can also remove the -h flag at this point since we longer need human-readable values for the other fields.
$ df /mnt/volume_fra1_mongo | awk 'NR==2 {print $5}'

61%
Another way of doing this would be to invoke df with --output=pcent to only print the disk usage percent field. However, this option wasn’t available when I was testing on macOS. Furthermore, --output doesn’t trim whitespace, so I would end up using awk anyways.
However, there is one final thing we need to do. We need to remove the % symbol. We can do that by using the substr function in awk:
$ df /mnt/volume_fra1_mongo | awk 'NR==2 {print substr($5, 0, length($5)-1)}'

61
Another way of doing this would be use bash string operators. However, I decided to stick with trying to do everything in one awk command.
Now let’s just assign the value to a variable in our bash script and we’ve successfully extracted the metric value that we want!
USAGE=$(df /mnt/volume_fra1_mongo | awk 'NR==2 {print substr($5, 0, length($5)-1)}')
Sending our metrics to Grafana
The next part of our bash script consists of pushing the metric to Grafana. For this we need to construct a JSON payload and send a HTTP POST request to the Grafana Cloud API. See my other post for more details about sending metrics to Grafana here.
First we need to generate a unix timestamp in seconds. This can easily be done using the date command:
TIME=$(date +%s)
Next we need to generate our JSON payload. In this case we’ll use cat with an EOF token since our payload contains quotes and we want to perform variable substitution.
DATA=$(cat <<EOF
[{ "name": "mongo.volumeUsage", "interval": 1, "time": $TIME, "value": $USAGE }]
EOF
)
We also need to construct our Authorization header, which simply includes our ORG_ID and API key.
AUTH="Bearer $ORG_ID:$API_KEY"
Finally, we can POST everything using curl:
curl -X POST $ENDPOINT \
  -H "Authorization: $AUTH" \
  -H "Content-Type: application/json" \
  -d "$DATA"
Final script
Here’s what the final script looks like:
#!/bin/bash

MOUNT=/mnt/volume_fra1_mongo

# Parse disk usage percent
USAGE=$(df $MOUNT | awk 'NR==2 {print substr($5, 0, length($5)-1)}')

ENDPOINT=https://graphite-us-central1.grafana.net/metrics
ORG_ID=... # <your grafana org id here>
API_KEY=... # <your grafana api key here>

TIME=$(date +%s)
AUTH="Bearer $ORG_ID:$API_KEY"

DATA=$(cat <<EOF
[{ "name": "mongo.volumeUsage", "interval": 1, "time": $TIME, "value": $USAGE }]
EOF
)

curl -X POST $ENDPOINT \
  -H "Authorization: $AUTH" \
  -H "Content-Type: application/json" \
  -d "$DATA"
Cron job
The only thing left to do now is to setup a cron job.
crontab -e
Let’s invoke the script every minute:
# Report volume disk usage every minute!
* * * * * bash ~/report-volume-usage.sh
