Hosted Monitoring: Evaluating InfluxDB Cloud and Grafana Cloud
We’ve been self-hosting Grafana and an InfluxDB database for a long time, using it for monitoring our custom application metrics. However, we started to push our patience with maintenance and the limits of performance on a $5/mo DigitalOcean droplet.
In an effort to simplify things we started exploring what hosted solutions are available. Really, we just want something simple and cheap. The two main options we considered were InfluxDB Cloud and Grafana Cloud, both offering fairly generous free-tiers.
InfluxDB Cloud
We started with InfluxDB Cloud, mainly because we were already using InfluxDB as our data store. Thus, we didn’t have to rewrite any of our code that pushes metrics. Overall our first impressions were good, onboarding was simple and the UI looked nice. We were quickly able to get our data into InfluxDB Cloud as well, and could start setting up our panels and alerts. This is where we started to run into issues.
InfluxDB Cloud panels are very limited (and buggy)
Coming from Grafana, we were used to a certain degree of customization. InfluxDB Cloud however offers very limited customization. For example, there are only 3 options available for Y-axis units and legend options are very limited.
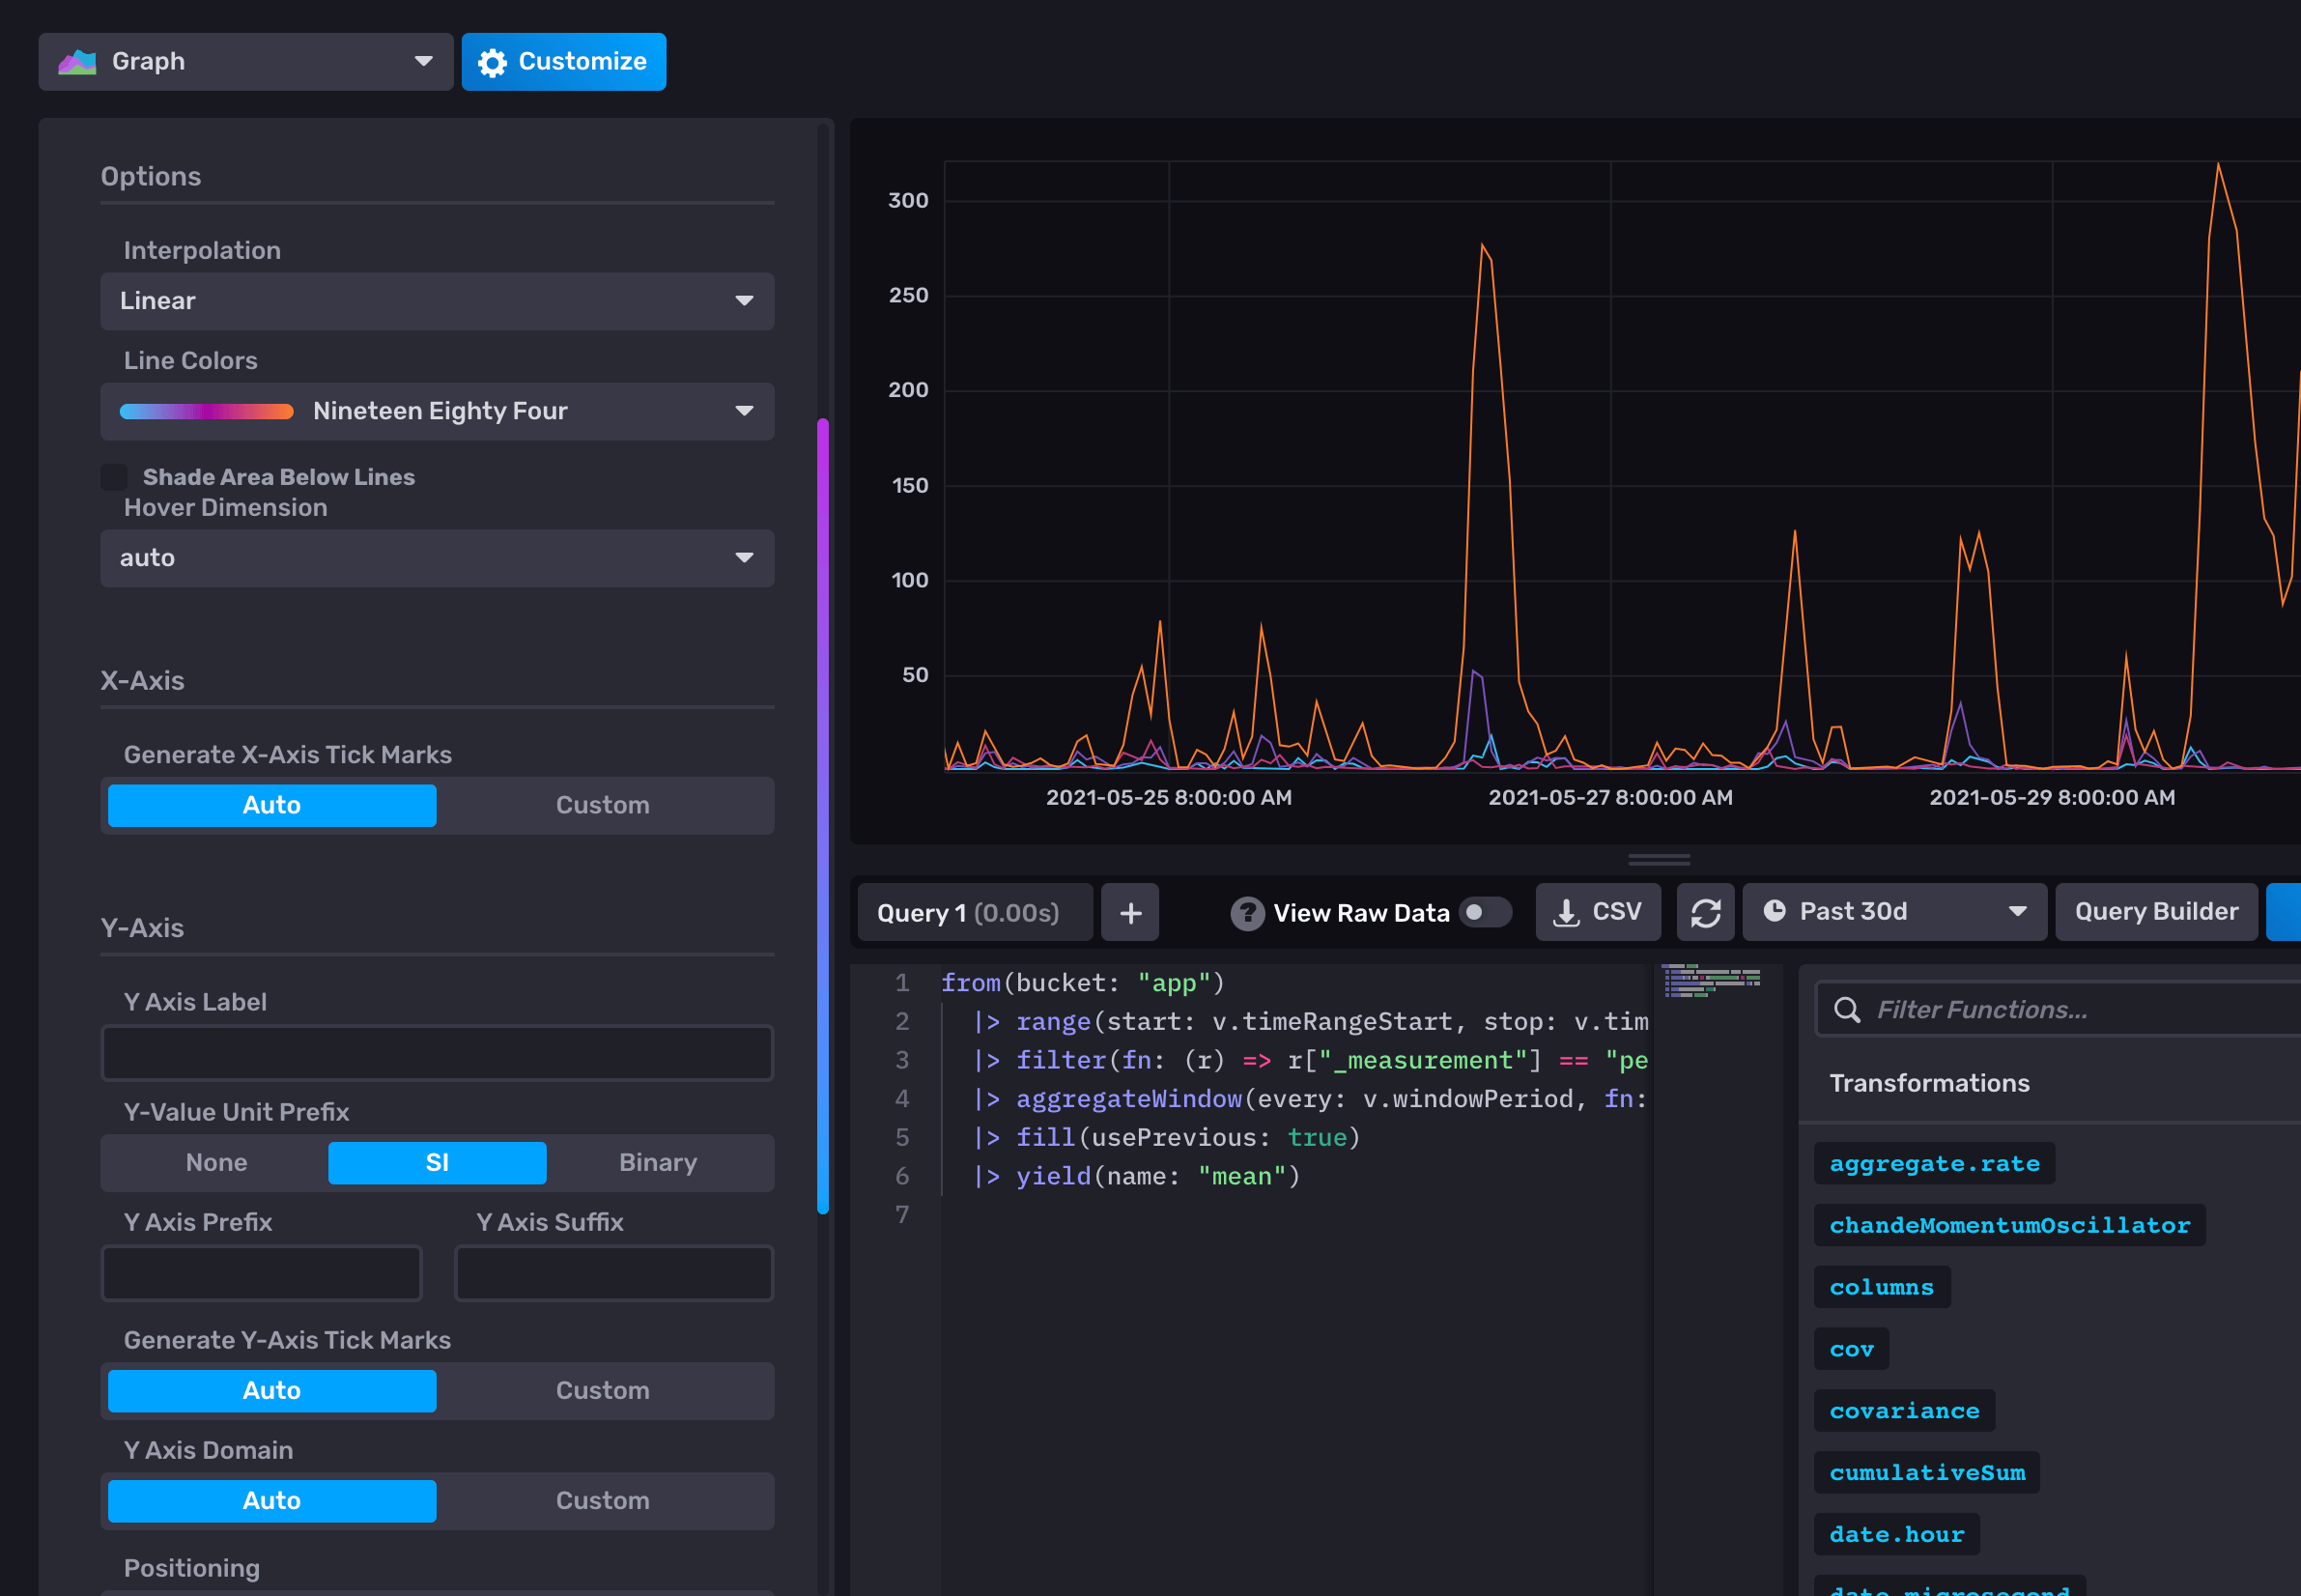
Visually one of the most frustrating things was that the graph series colors kept changing every time you refresh the data, making it very difficult to keep track of what you’re looking at.

Another very frustrating feature (or lack thereof) is that the hover tooltip does not give any indication of the specific series your mouse cursor is currently hovering over. A simple solution here would be to make the actively hovered series hold or emphazied.

We couldn’t get InfluxDB Cloud alerts to work at all
While we could live with the visualization and customization issues, alerts was were we completely gave up on InfluxDB Cloud. No matter how much we tried, we just weren’t able to get a simple basic alert to work.
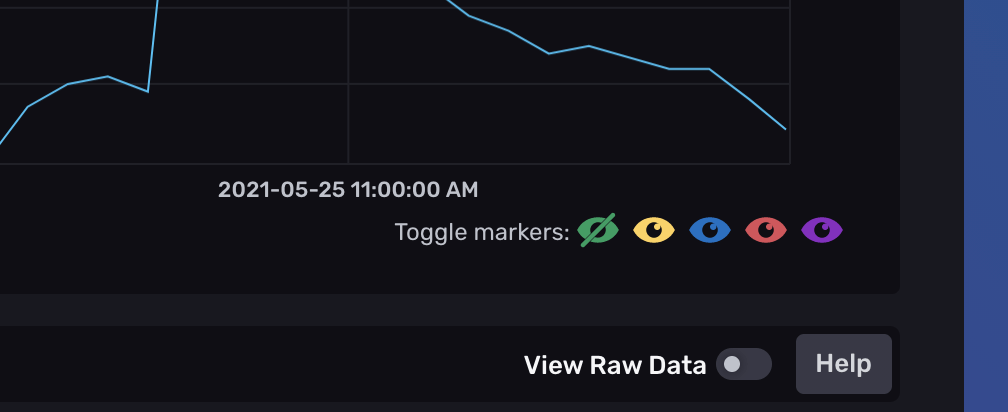
The process of setting up alerts was not very intuitive. For example, the “Checks” UI let’s you setup your desired thresholds. The graph includes options to toggle the threshold markers. Yet these don’t actually do anything at all, and the inputted thresholds aren’t shown in the UI. This is where I got stuck first, thinking my thresholds weren’t set, when in fact they were.
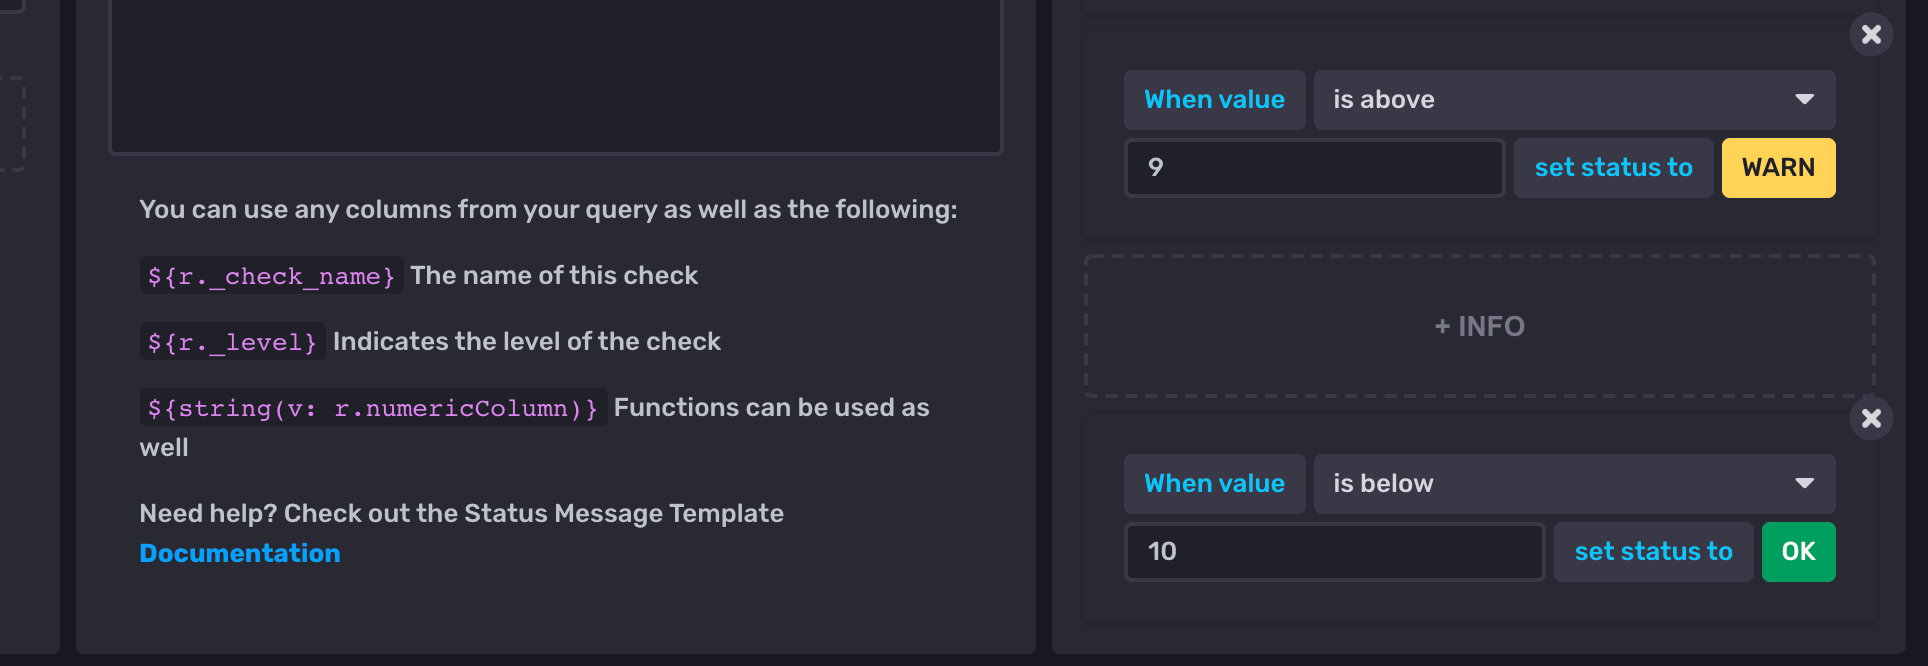
It’s also easy to accidentally introduce “gaps” in your threshold levels. At first you may think to setup an alert like this (OK below 10 and WARN above 10). Well, then you’re missing the value of 10 (which becomes an “unknown” state).

So in this case you should setup something like this instead (WARN above 9 and OK below 10), which is correct but just feels wrong. I’m sure they could have come up with a better solution for this.
However, after adding a “Check” and setting up my “Notification Endpoint” I still wasn’t getting any alerts. After some time I realized there was another UI I had missed, namely “Notification Rules”.

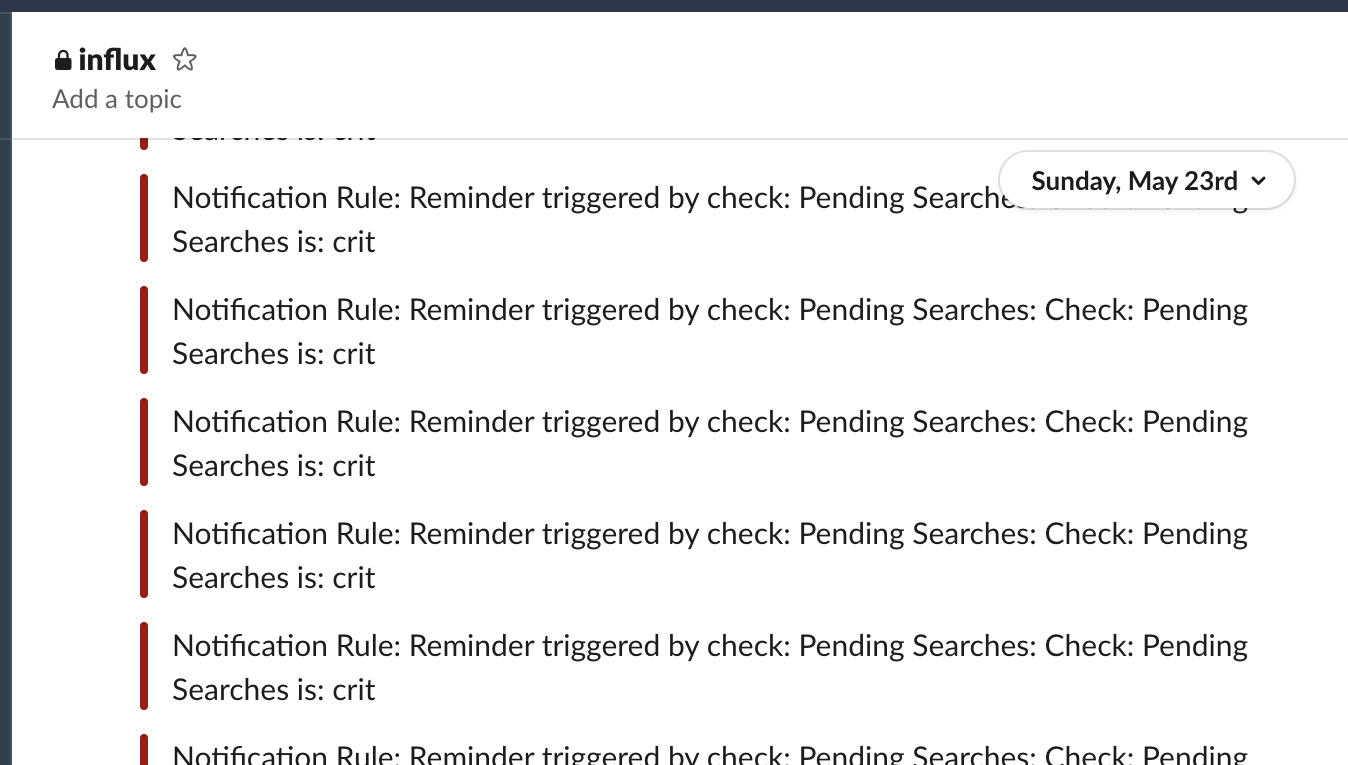
I got quite excited at this point, since there seemed to be a lot of flexibility. I started by testing setting up an alert that would remind us every 24 hours if an alert was still critical. While this did in fact work, it also resulted in our Slack getting completely spammed with 100+ notifications. I’m not sure why… but we quickly removed this alert.
After this I tried setting up a simple alert for when the status changes from OK to CRIT. This however, just didn’t work. No alerts were sent. At this point we gave up, after having spent more than 1 week trying to get things to work.
One thing to keep in mind is that InfluxDB Cloud’s free tier only includes 2 alerts (so we would have definitely needed to upgrade to the paid tier if we had decided to stay with InfluxDB Cloud).
Another bug we ran into was that at one point a team member tried resetting their password, which instead created a brand new organization and was no longer able to re-join the original organization without creating a new account using a new email address…
Let’s try Grafana Cloud instead.
Grafana Cloud
Even though we were previously using Grafana for visualizations we were a little hesitant to try Grafana Cloud. The main reason was that we would need to switch from InfluxDB for our storage to either Graphite or Prometheus, which are offered on Grafana Cloud.
Since we are primarily monitoring basic application metrics we ideally just wanted a simple endpoint that we could push our data to (no need for fancy buffering, redundancy or error checking). Also, since our application is running in a PaaS we didn’t want to have to install any extra local dependencies in order to push data to Grafana. Initially I thought it was a requirement to have a local agent running, but we did eventually figure out how to push metrics to Grafana using the Graphite HTTP API.
Pushing data to Grafana
It was a little tricky to find, but it is possible to push data directly to Grafana Cloud using the Graphite HTTP API. The documentation can be found here. If the link doesn’t work, try Googling for it since their docs links seem to change and break quite often.
They also provide a small example GitHub repo, which I used as a starting point.
Here’s a minimal example written for node.js:
const API_KEY = '<orgId>:<token>';
const ENDPOINT = 'https://graphite-us-central1.grafana.net/metrics';

// get current unix timestamp
const time = Math.floor(Date.now() / 1000);

// we're reporting values every 10 seconds
const interval = 10;

const data = {
  time: Math.floor(time / interval) * interval, // align timestamp to interval
  name: 'app.some_metric.some_field',
  interval: interval,
  value: 1.234,
  tags: ['type=foo', 'kind=bar'],
};

const headers = { Authorization: `Bearer ${API_KEY}` };

got.post(ENDPOINT, {
  headers,
  responseType: 'json',
  resolveBodyOnly: true,
  json: data,
});
One important thing to remember with Graphite is that metrics have to be aligned to the given interval. For example, an interval of 10 means that there will be one value for the given series every 10 seconds. It is best to make sure you push your metrics slightly more frequently then the interval to make sure you don’t miss any time slots, which would result in gaps (null values) in your data.
Querying Graphite with tags
Since we’ve only been using InfluxDB as a data source in Grafana previously, there was a bit of a learning curve with Graphite. In particular, I was having a hard time figuring out how to use tags. However, once you understand the syntax it’s fairly easy to use.
Series without tags are fairly straightforward, simply select the desired metric in the dropdown.
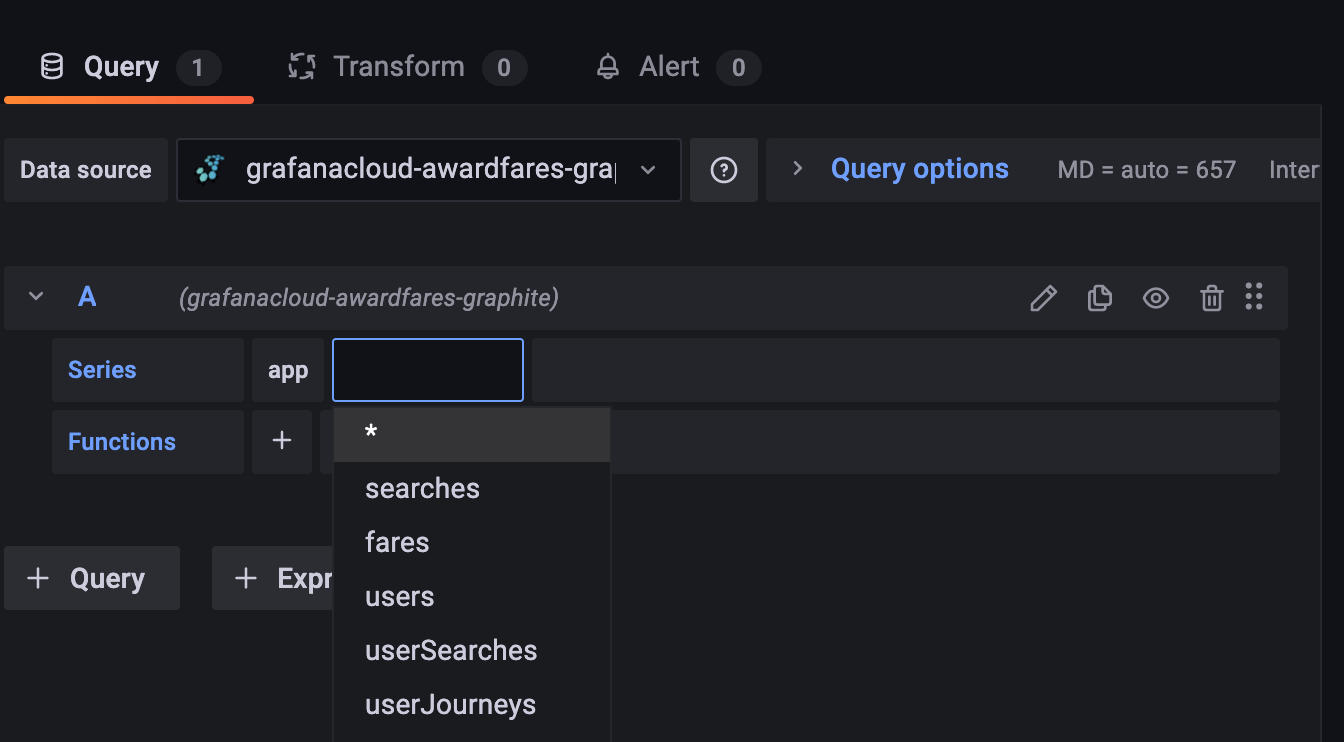
However, for series with tags, you first to have select Tag: name in order to choose your metric (I didn’t realize graphite automatically created the “name” tag, so I was confused about this at first).
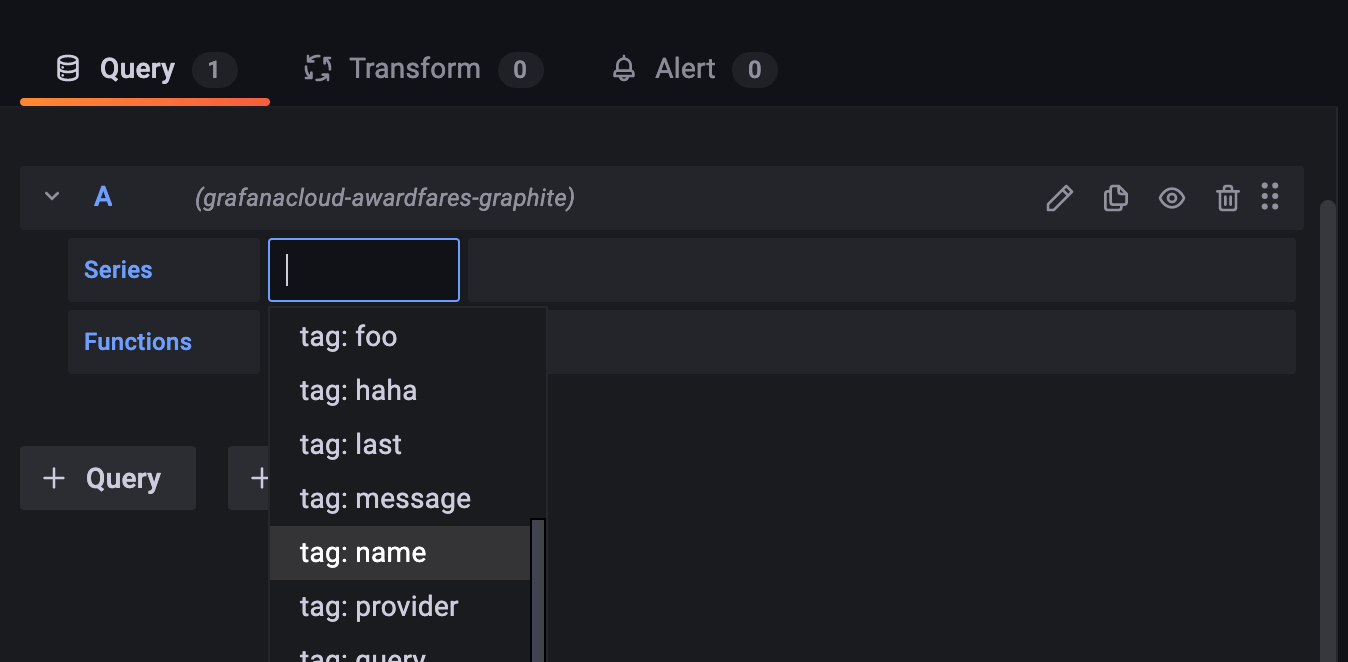
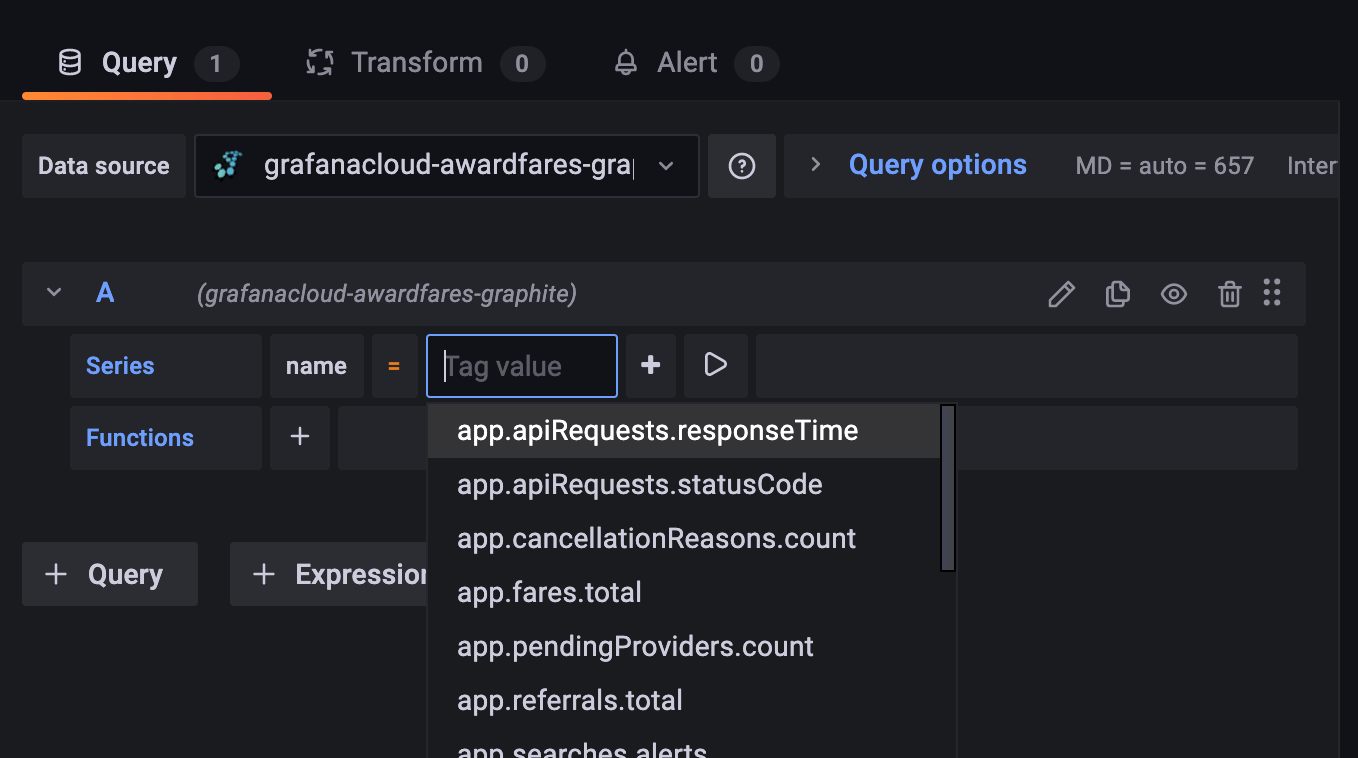
Then select the desired metric as the tag value.
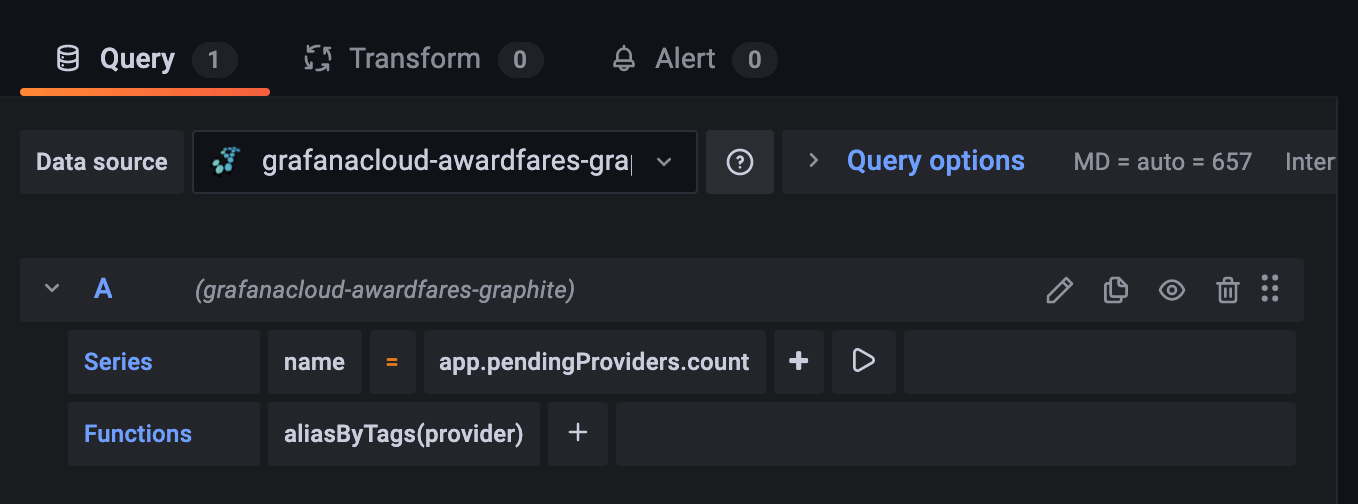
After that, you can add additional tags to filter the data by tag value, and you can also add functions such as aliasByTags to name each series by their tag value (resulting in better looking legends).
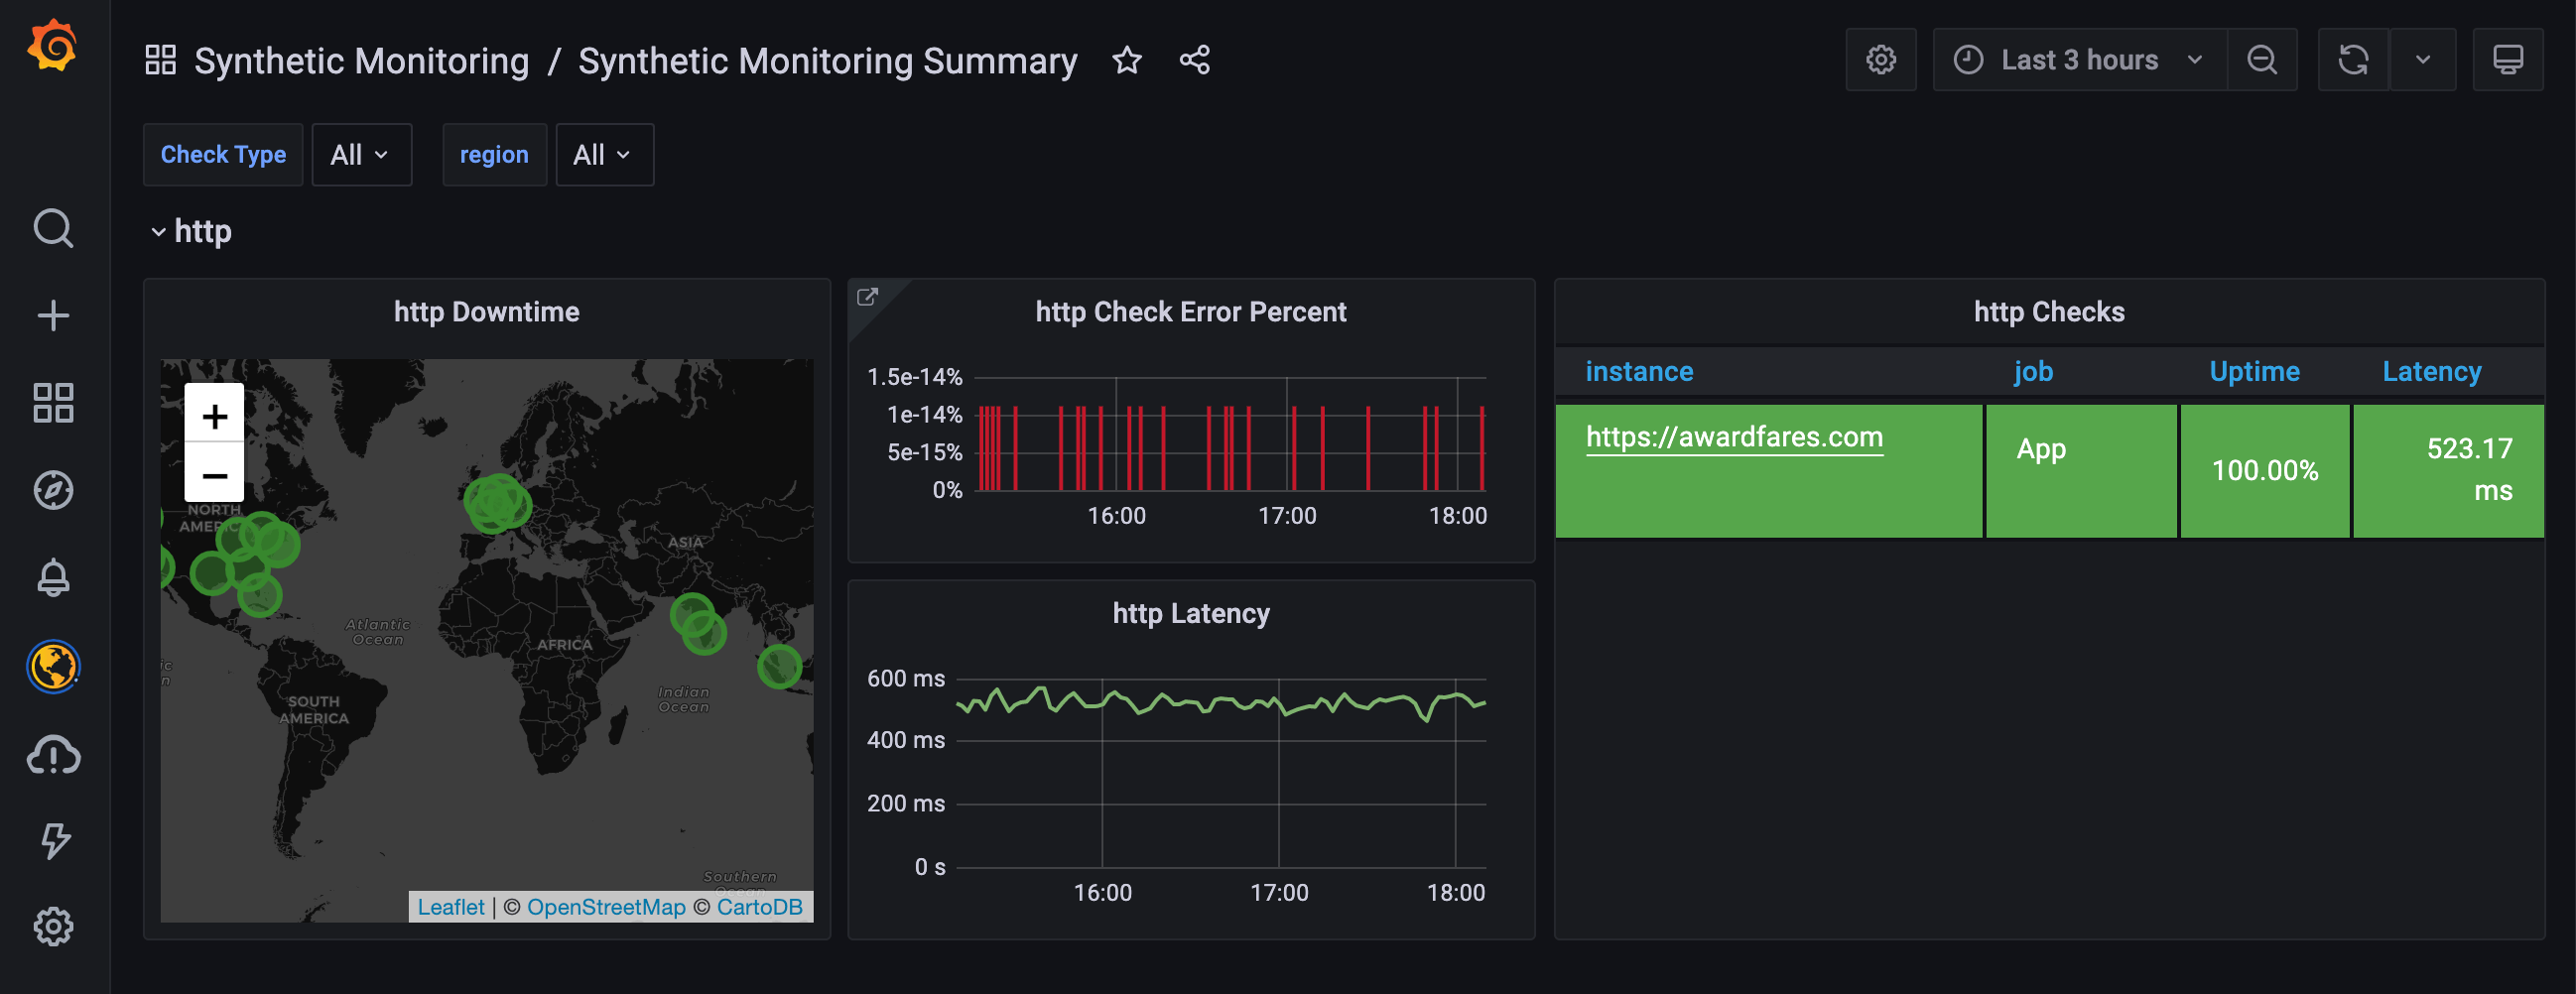
Syntehtic Monitoring
Another bonus feature we discovered is the Synthethic Monitoring feature, also available in the free tier. It provides some basic application monitoring, with downtime monitoring and global latency checks. Nice to have!
Free-Tier Comparison
Overall both options have very generous free tiers, great for anyone looking to get started with basic monitoring. The biggest drawback with InfluxDB Cloud is that they only offer 2 alerts on the free-tier, which feels very low in my opinion.
InfluxDB Cloud Free-Tier:
- Series: 10,000
- Retention 30 days
- Alerts: 2
- No storage limit
- Writes: 5MB/5min
- Queries: 300MB/5min
Grafana Cloud Free-Tier:
- Series: 10,000
- Retention: 14 days
- Alerts: 100
- No storage limit
Conclusion
The biggest difference between the two is clearly the maturity and rich feature-set offered by Grafana, whereas the solution InfluxDB Cloud offers feels lacking and buggy. We’ll stick with Grafana Cloud for now!